Plotting Practice
Small lessons on charts, using a synthetic weather dataset anyone can download.

Latest
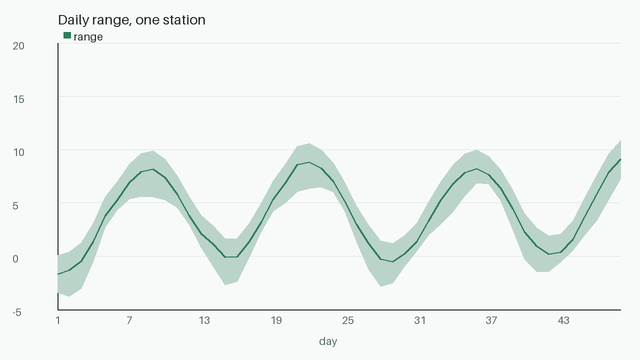
Daily ranges as bands
Minimum and maximum as a shaded band around the mean.
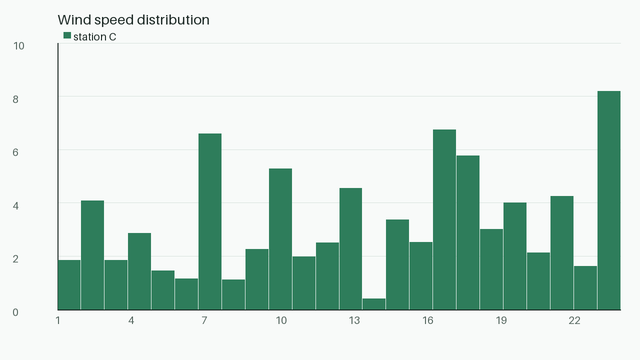
Histograms and bin width
Too few bins hide shape; too many show only noise.
Timeouts and budgets for chart rendering
Rendering 26 000 points per station is quick; rendering them as individual markers is not. Aggregate first, plot second, and give the notebook cell a time budge
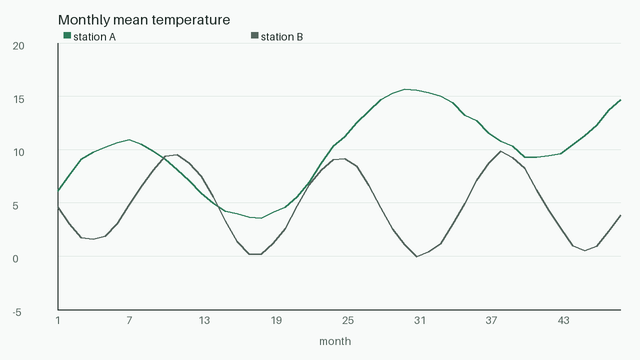
Line charts with honest axes
Start the axis where the data makes sense, and say so.